The first thing to do in a Rietveld refinement is to have a careful look at the plot window. Zoom inside the plot panel (by click, hold and drag a rectangle in the plot) to check the details of the fitting, see if there are peaks not fitted well, missing etc. Have a look on the residuals, from the residual profile you may recognize peak shifts, asymmetry problems and profile shape problems. It is much more easy to see them in the residuals than in the plot.
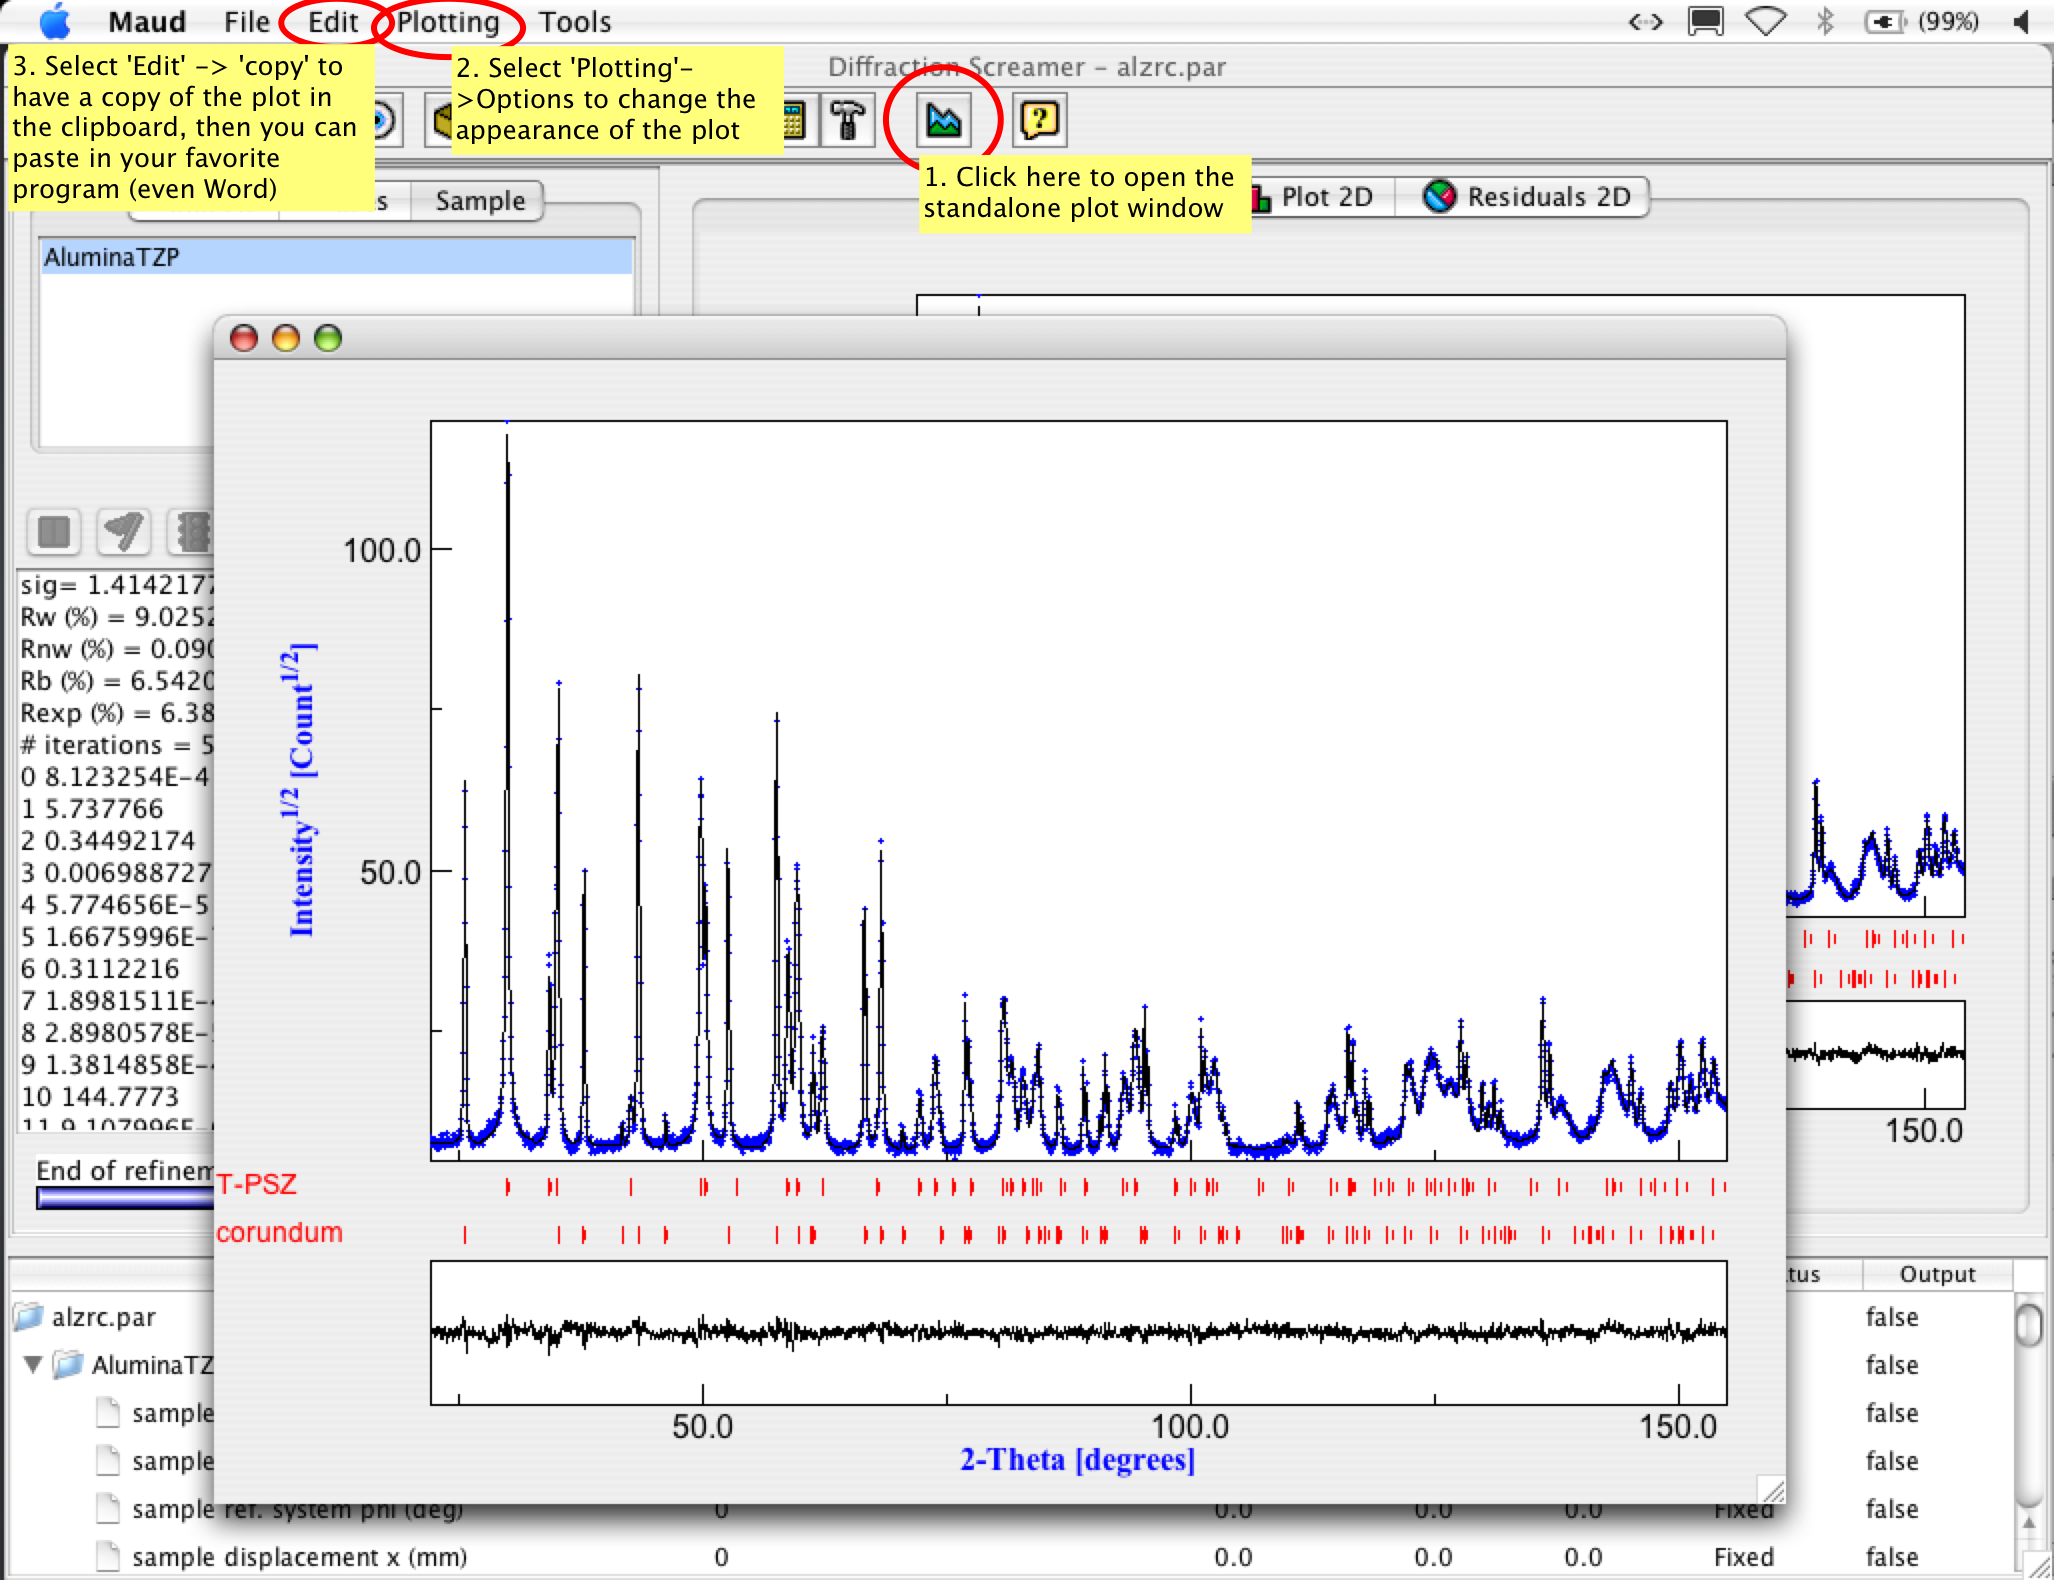
To have a bigger more customizable plot window click on the 'plot selected dataset' toolbar icon (the one with a plot graph icon, circled in red in the following picture). A new standalone plot window will appear with its own menu (on the Mac picture below it appears on top of the screen, in Windows it will be on top of the plot window). Resize the window as you prefer (ATTENTION: do not enlarge it full screen with the button on the window bar, but resize it instead, because Maud remember the size and position of the window and next time it will be hard for you to get a smaller window if you need).
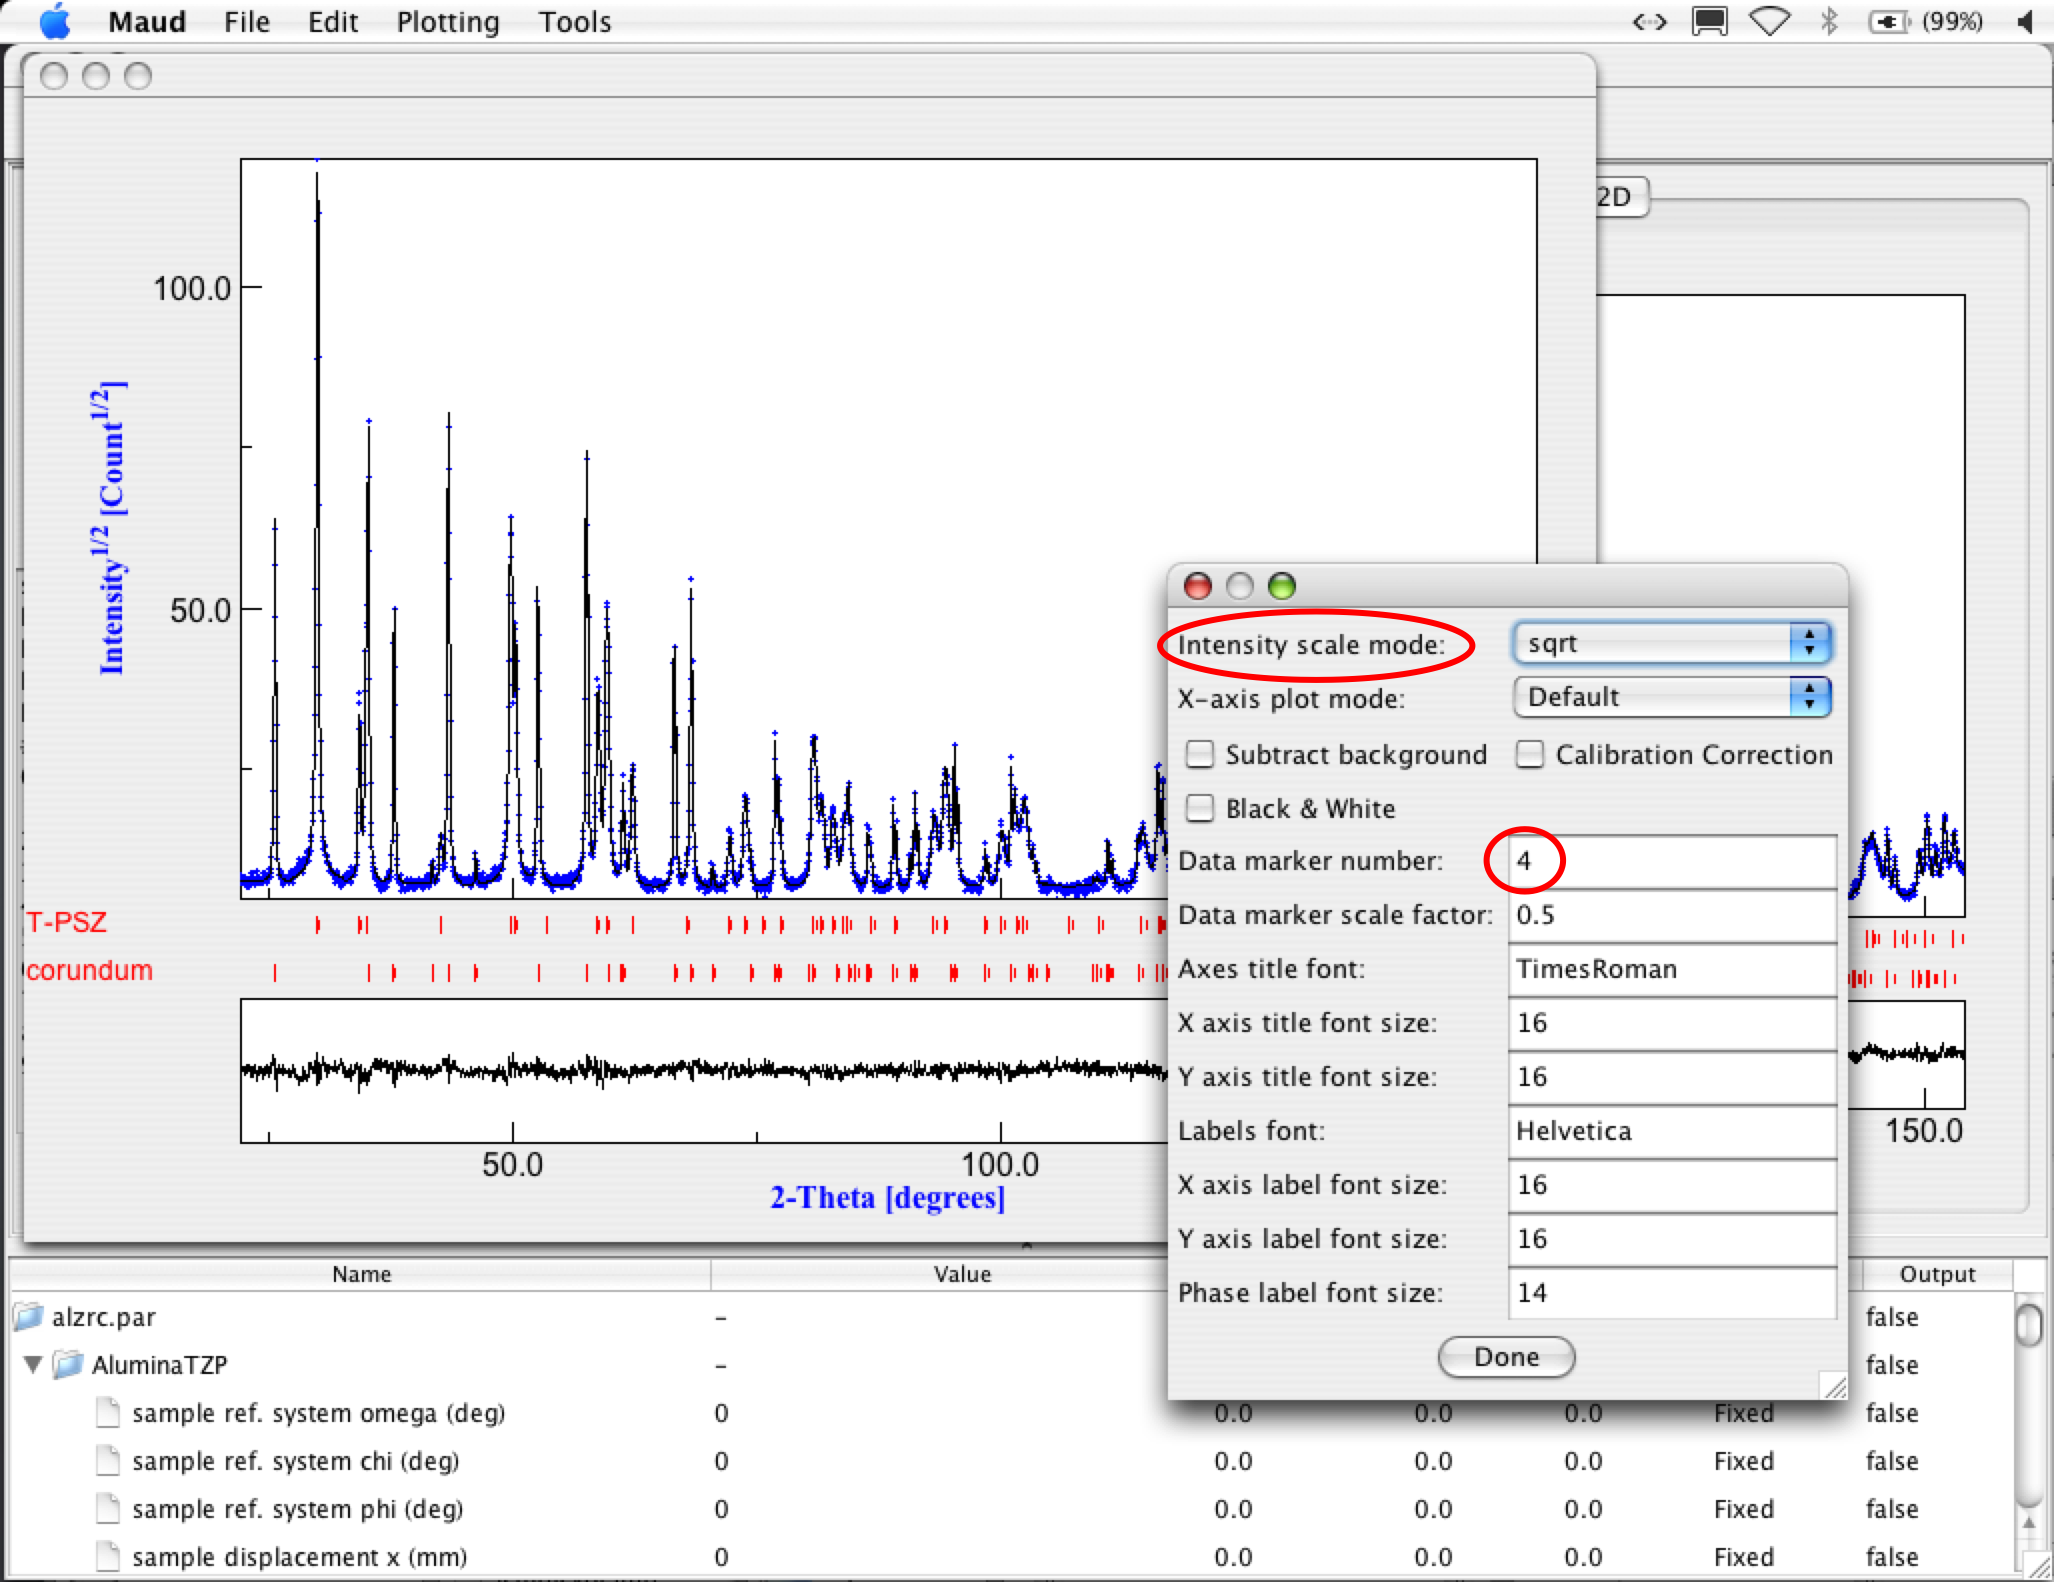
You can change some plot options by selecting the menu item 'Options' from the 'Plotting' menu of the Plot window (see picture below).
Copying and pasting the plot in you favorite graphic program, or Word whatsoever is easy by selecting 'copy' in the 'Edit' menu of the plot window (this works only in the standalone plot window).
Plot window
TIP: plotting the intensity in sqrt permits a better evaluation of the residual as they will be plotted at iso-statistical-error because the intensities in diffraction have errors proportional to the sqrt(intensity). Also you may better see small peaks compare to the big ones.
Plot window
You can change also the data markers. The kind of marker can be selected by changing the number of the marker (the default is 4) There are already 10 markers defined in Maud (from 1 to 10), in addition if you put -1 in the data marker then you will get a line for the data plot. If you want to change the marker appearance and get your ones have a look at the 'marker.txt' file in your examples/databases/preferences directory. Simply add a new marker at the end and define it. It is straightforward to understand how the script works.
Close the plot window at end. Remember to not leave opened Maud windows around has if you open one twice there is no control and you can mess up the parameters a little.
Close the window when finished.
Plot window
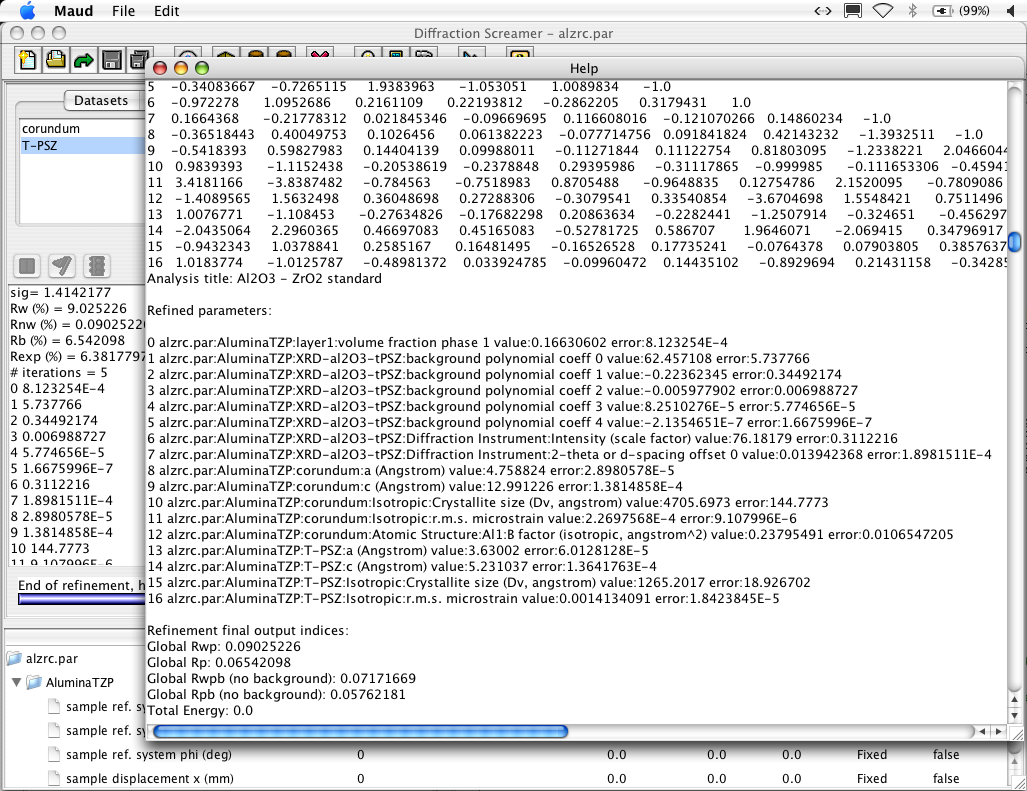
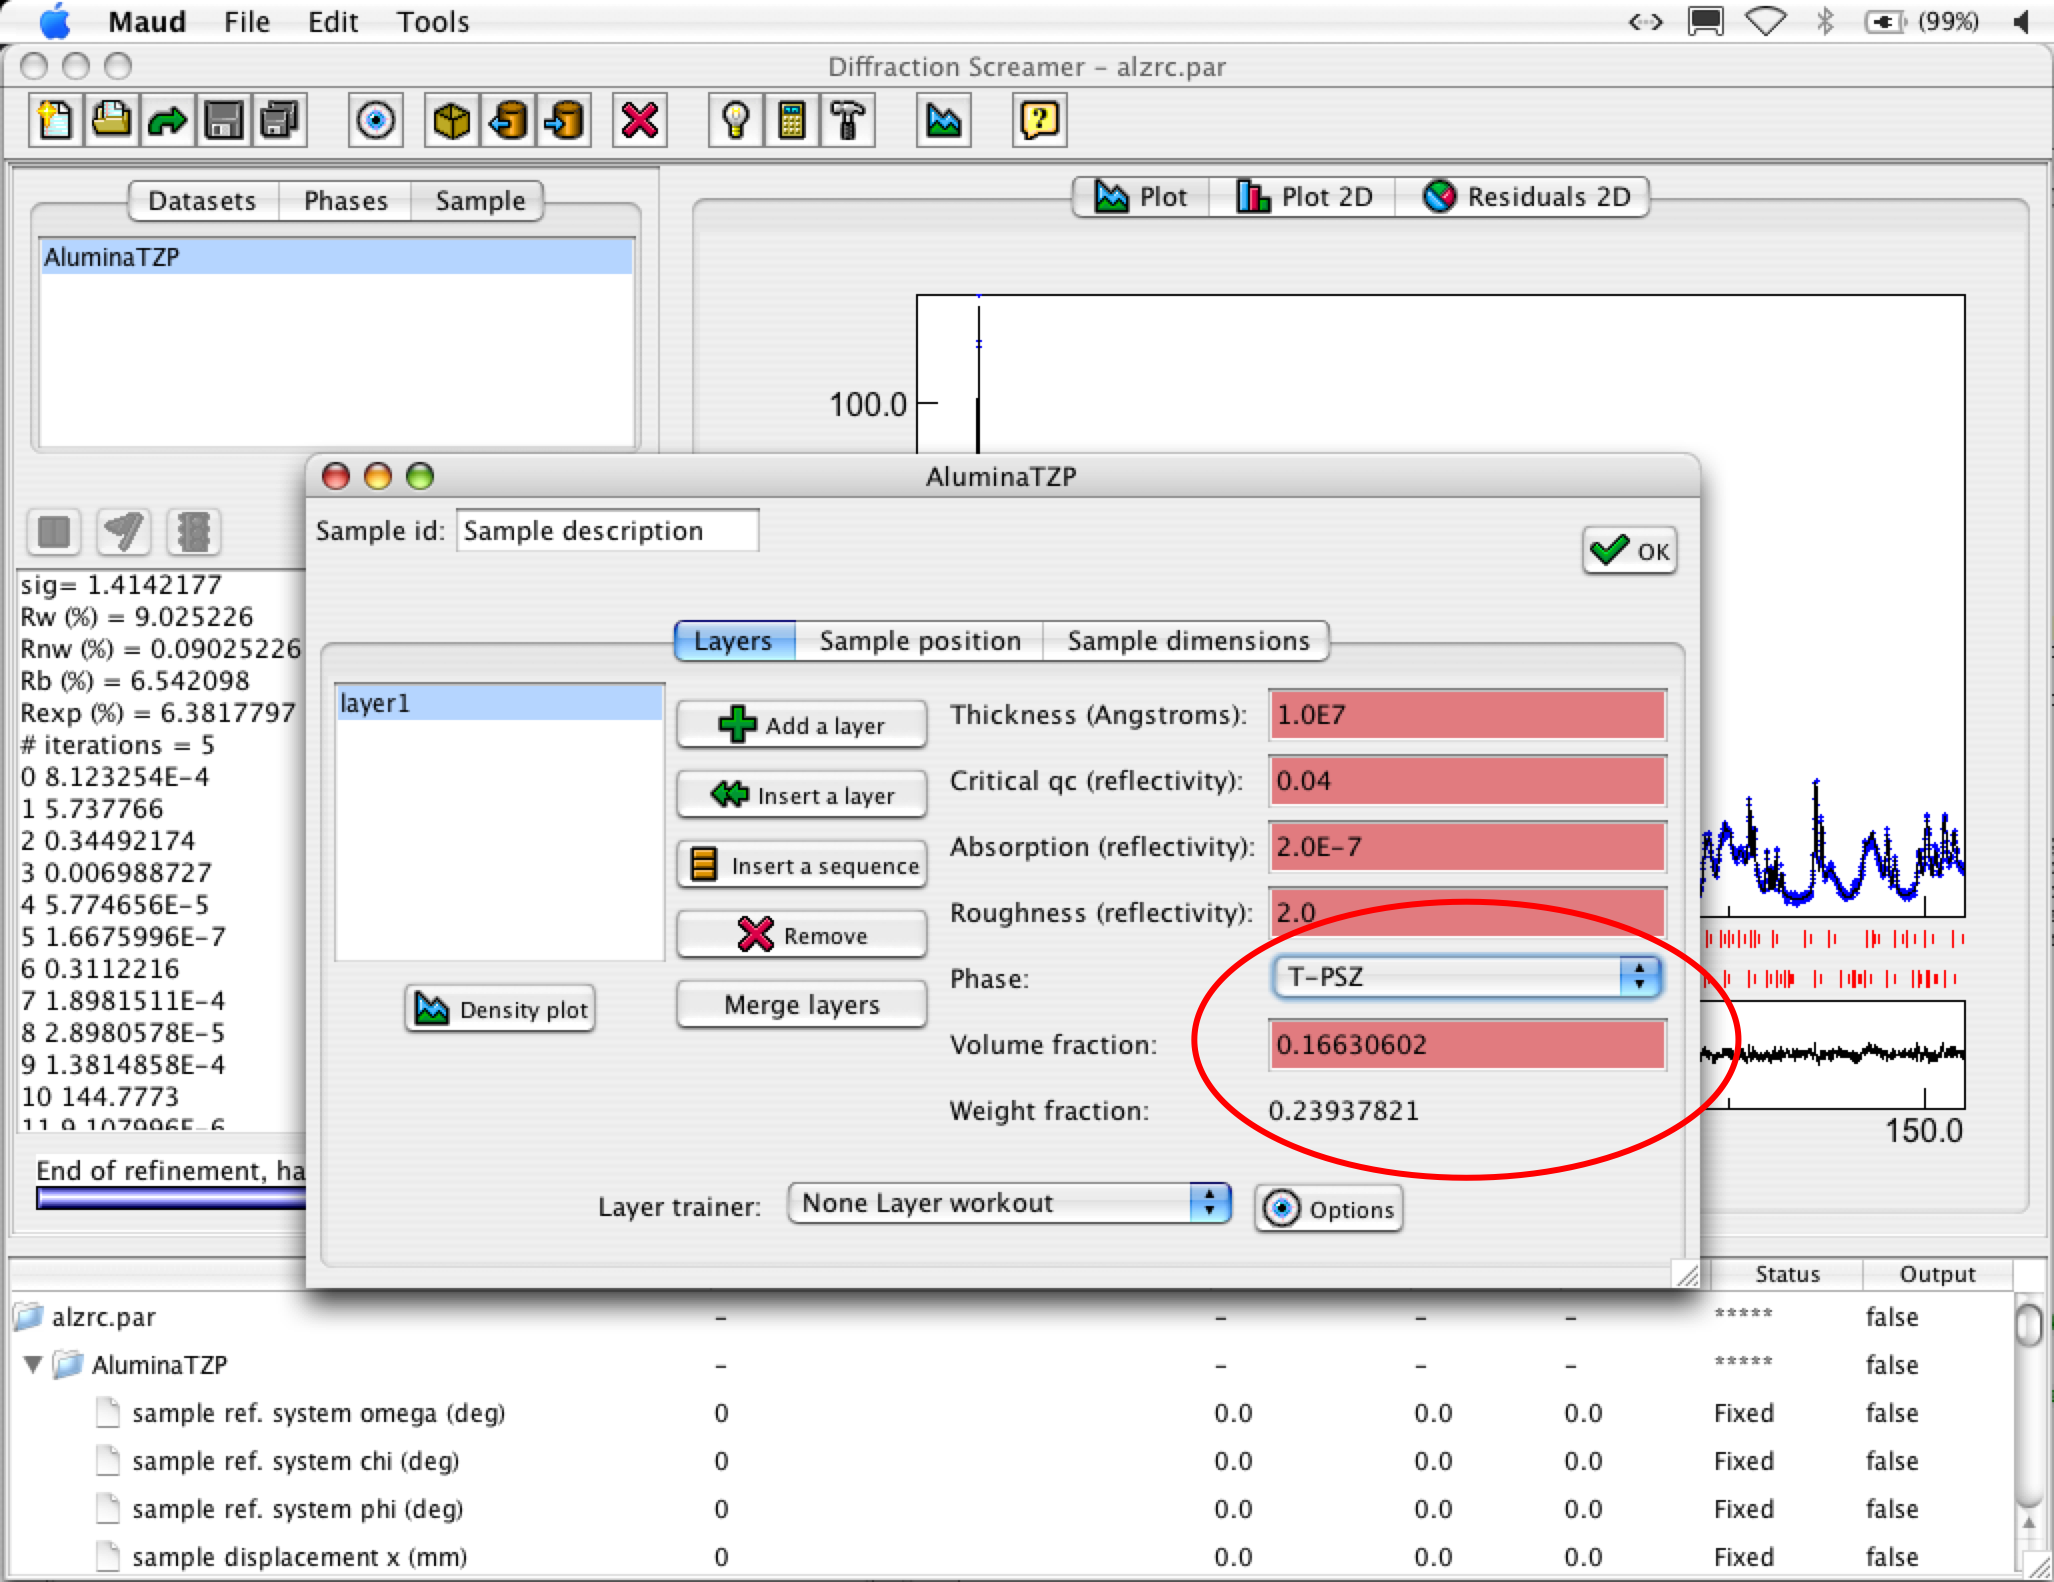
In the main Maud window, select the 'sample' tab panel in the upper-left part of the window. Select the only sample present there and press the 'edit' toolbar button ('eye' toolbar button). A new window will appear like in the picture below. Looking at the picture where the red circle is, you can select the phase you want and see the volume and phase fractions. Errors are reported only for the refined phase fraction in the result (up) or parameter list (below) windows.
Parameter list window
Parameter list window