Checking out the analysis results (step 7)
- We are now ready to analyze the results. Go to the "Datasets" tabPanel and
select your dataset. From the 'Graphic' menu, click on 'Plot selected dataset' to look at
the refinement. You can zoom in to magnify some details. To go back, just double-click on
the plot frame.
Plot window
- Now, select the 'Results' option from the 'Refinement' menu. A new window shown below
will appear. You will find all the information listed in the text box during the
calculations. The most significant parameter concearning our quantitative analysis have
been pointed by the arrow: it indicates the volumetric quantity of Al2O3 in a fraction of
1 (the T-PSZ quantity is complementary to 1).
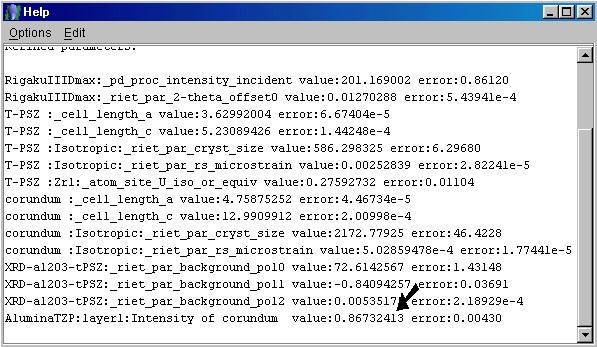
Results textbox
- The highlighted parameter can be found in the "Samples" tabPanel fields.
Select your sample in this tabPanel and click on the 'Edit' button. Choose the
"Layers" tabPanel in the new window. Look again at the "Phase" and
"Volume fraction" fileds. You will see that they have been changed by the
program algorithms into the final quantities of the two phases.
- If you go back to the MAUD main window, you can also have a global view of all the
results in 'Parameters list' option from the 'Refinement' menu. You will find here all the
parameters, their values and the error computed if a parameter were refined. The positions
of all the fields are the same that you found in the MAUD main panel structure.
- Save the analysis using the 'Save' option in the 'File' menu.